Live Air Pollution Monitoring
The plot below shows real-time PM2.5 levels measured in my area. This page updates with fresh data several times per hour.
I live close to Copenhagen Airport, and I care about the local air quality. The pollution in this area particularly due to particle emissions from aircrafts and woodburners. This project is my attempt to monitor the environment on Amager, and to raise awarenss.
According to the Danish Ministry of the Environment, an estimated 4,000 Danes die prematurely every year due to air pollution–that’s more than 10 people every day.
I am working on open-source hardware and software to make this project possible. The goal is to create a low-cost air quality monitoring system that can report from multiple locations, and to make the data available to the public.
Right now, I am sharing the data from my prototype (see below), but I am also working on a more robust version that will be deployed outdoors.
I’ve designed a PCB that is being manufactured, and I need to do more testing before I can deploy more measureing stations.
What is PM2.5?
I’m focusing on a specific type of air pollution: PM2.5. PM2.5 refers to fine particulate matter that is 2.5 micrometers or smaller in diameter. These particles are small enough to penetrate deep into your lungs and even enter your bloodstream.
The reason that I am focusing on PM2.5 is a good measure of particle pollution, and it is also realitvely easy to measure.
What is measured?
The PM2.5 levels are measured in micrograms per cubic meter of air (µg/m³) . The World Health Organization (WHO) recommends that PM2.5 levels should not exceed 5 µg/m³ as an annual mean, and 10 µg/m³ as a 24-hour mean.
As you can probably see from the plot above, the levels in my area are often much higher than this.
During the winter months, when the air quality is often poor due to woodburning in private households. Woodburners are the single largest source of PM2.5 emissions in Denmark, and they are responsible for about 43% of the total PM2.5 emissions in the country according the Danish Ministry of the Environment.
In the summer, the levels are mostly affected by emmisions from the airport, and will depend heavily on the wind direction.
One goal of this project is to collect the data do document this and estimate the health effects.
What hardware am I using?
I’m currently using a PMS5003 sensor, which is a low-cost laser-based sensor that can measure PM1.0, PM2.5, and PM10 levels.
If you are interested you can read a scientific review of the PMS5003 sensor here:
For practical purposes the accuracy is about ±10% for PM2.5, which is more than sufficient for this project - simply to determine whether the air quality is mostly good or bad.
How It Works
This is a custom solution built with open-source tools and low-cost hardware:
- I’m using an ESP32 microcontroller connected to the PMS5003 particle sensor.
- The PMS5003 sensor continuously measures particle levels and sends the data to the ESP32.
- The ESP32 pushes data to a bucket on InfluxDB Cloud every few minutes.
- A simplecron job on my Raspberry Pi pulls this data periodically, processes it, and uploads it to a public GitHub repository.
- This blog then loads the latest data from that github repo and serves it in the plot above.
Future Plans
My plan is to monitor the air quality from several locations on Amager, and to make the data available to the public.
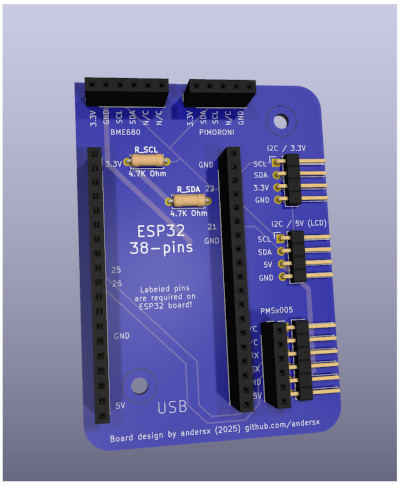
To make this possible, I’m currently working on a custom PCB to integrate everything.
- It will include the PMS5003, an ESP32, and support for a small LCD display.
- I’m also designing a 3D-printed enclosure to make the sensor weatherproof and mountable outdoors.
- Here’s a preview of the prototype being manufactured:

I designed the board in KiCAD, and it’s currently being fabricated by PCBWay.
Photos of the Current Setup
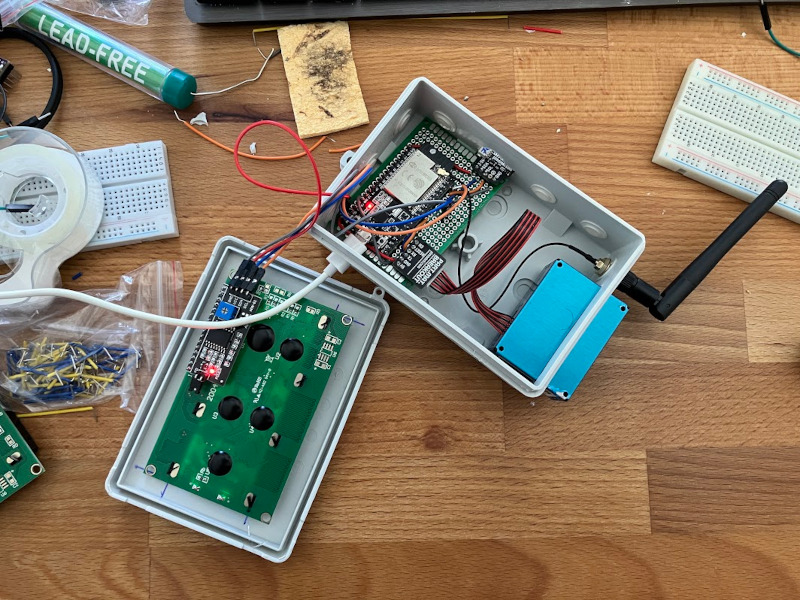
Here’s the current test setup, mounted under my soffit:

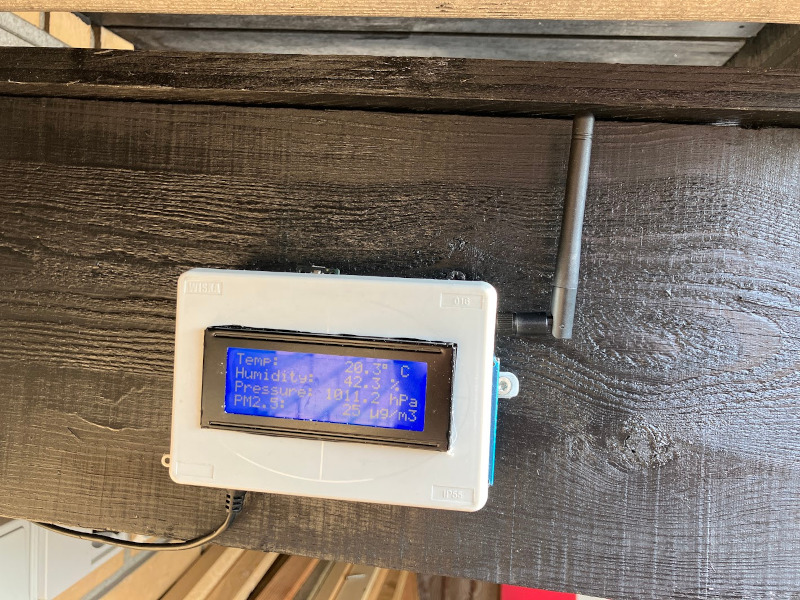
And here’s the final version enclosed and deployed:

– Anders